(Click ![]() on the Home page for the selected Transmitter-Sensor.)
on the Home page for the selected Transmitter-Sensor.)
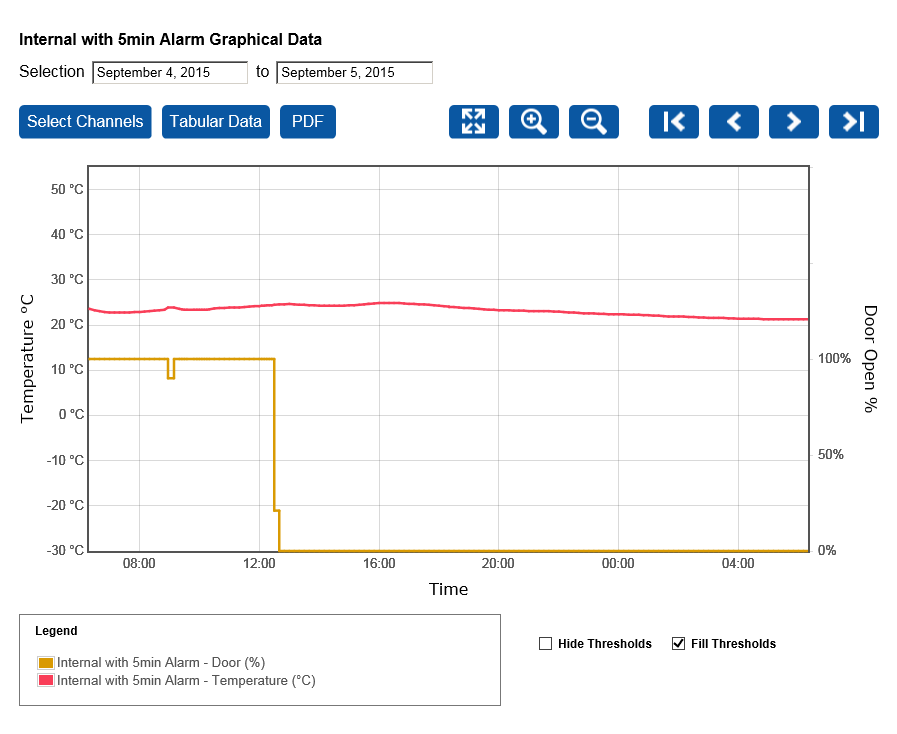
Temperature value (in °C in this case) is shown on the left-hand axis, date (or time) on the bottom axis, percentage of time open over a 10-minute period (for a door switch) is on the right axis. Temperature is in red, door switch time open is in yellow. If the Transmitter-Sensor doesn't have an associated door switch, the yellow graph line does not appear. So in the above example we see that a door has been open 0% of the time (i.e. closed) from approximately 13:00 - 06:00 a door has been left open for approximately 100% of the time within the period from 06:00 - 13:00.
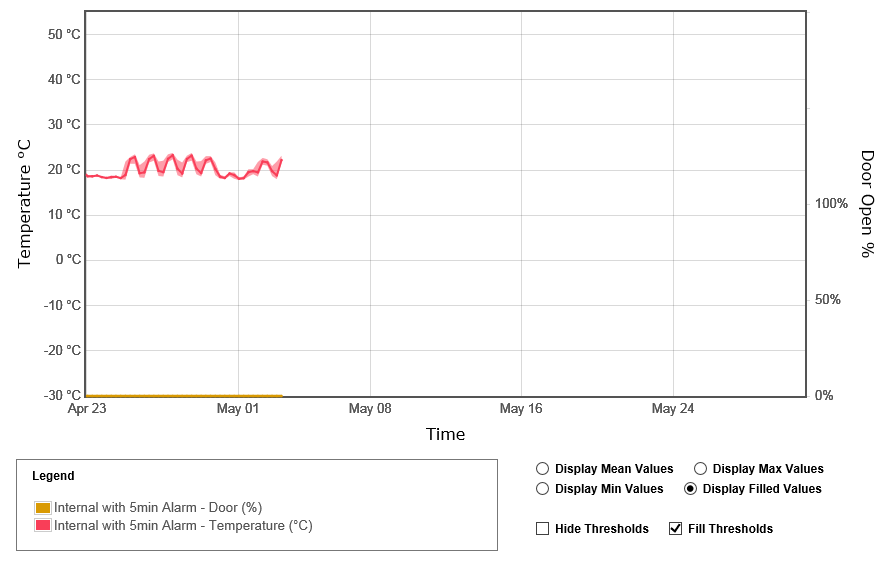
| Note: | The default display shows one day's data, you need to zoom out to see more data. The Display option buttons operate on two or more day's worth of data, and will not be visible until you zoom out. The example below shows the lower half of a 'zoomed out' display: |
You can:
1.Click anywhere inside the left (start) date box. |
2.In the displayed calendar, select the required start date (current start date is highlighted). •The graph changes so that the selected date is at the left-hand edge of the date range on the bottom axis. |
3.Click anywhere inside the right (end) date box. |
4.In the displayed calendar, select the required end date (current end date is highlighted). •The graph changes so that the selected date is at the right-hand edge of the date range on the bottom axis. |
You can zoom in or out to display temperature values over a narrower or wider time span, or you can zoom in on a specific part of the display. |
•To zoom in, click For example for a displayed date range of 13 - 20 April, clicking |
•To zoom out, click For example for a displayed date range of 13 - 20 April, clicking |
•To zoom in on a specific area, press and hold down the left mouse button and ‘drag out’ an area (moving the mouse horizontally) over the area of interest. |
•Click |
Click |
Click |
Click |
Sensors have 'channels', one for temperature, one for 'door open'. If your Transmitter-Sensor has two channels, both are displayed by default. |
1.Click |
2.The ch1 (channel 1, temperature) and ch2 (channel 2, door switch) tick boxes are preselected for the currently selected Transmitter-Sensor. Clear a tick box to remove the channel data from the graph display. •If you wish, you can select or clear tick boxes for other Transmitter-Sensors and show channel data for those Transmitter-Sensors on the same display. |
By default, the display shows actual (mean) values (solid line) and minimum and maximum temperature ranges in the shaded areas. |
•To display only mean temperature and 'door open' percentage values (over the displayed date period), select the Display Mean Values option button. The temperature and door open period shaded areas disappear, only the mean value temperature and 'door open' line remains. |
•To display only maximum temperature and 'door open' values, select the Display Max Values option button. The graph line changes to show maximum temperatures and maximum 'door open' percentage periods. |
•To display only minimum temperature and 'door open' values, select the Display Min Values option button. The graph line changes to show minimum temperatures and minimum 'door open' percentage periods. (The minimum 'door open' percentage will be 0%, meaning 'door closed'. |
You can display just threshold lines, or filled threshold ranges. |
•To display only threshold lines, clear the Fill Thresholds tick box. To go back to filled threshold ranges, select the Fill Thresholds tick box. |
•To remove threshold data completely, select the Hide Thresholds tick box. |
•Click To go back to a graphical display click |
•To save the tabular data as a .pdf file, click |